COXPRESdb

ver. 8.1

last update; Aug. 24. 2018

Tutorial 1:Functional estimation of a gene, ACTR3.

This example shows a usage of COXPRESdb for functional estimation of a gene.

(1) Gene search

Search "actin related protein 3" using search form next to the title logo in COXPRESdb.


(2) Keyword search result

In the keyword search, GO terms and gene fucntions are searched by the query term. The resulting page contains the gene function annotated by NCBI with links to the gene pages.

Entrez Gene ID is also shown for users to store the annotations to spereadsheets such as Microsoft Excel. Since primary key of gene page of COXPRESdb is Entrez Gene ID, storing their Entrez Gene ID is the best to access COXPRSdb, again.

Click the symbol of "ACTR3" to go the gene page.


(3) Gene page

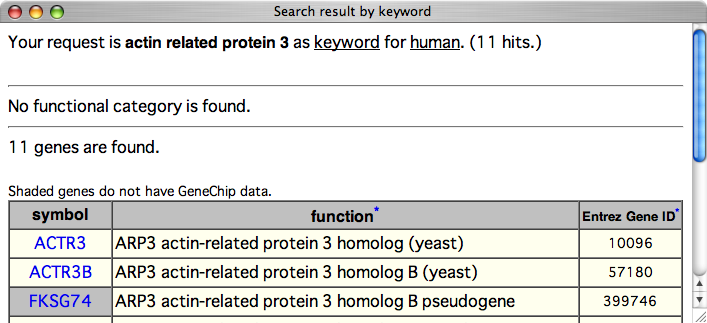
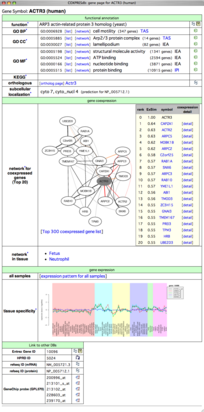
Gene page is the central page of COXPRESdb. It is mainly composed of three parts.

  1. Functional annotation part
  2. Gene coexpression part
  3. Gene expression part
The name of each part is indicated in a green bar.
IDs for others DBs are also provided as the forth part (small region in the bottom).


(3-1) Gene page; functional annotation part

The functional annotation part provides functional gene annotations obtained from NCBI, GO, KEGG, as well as protein subcellular localization predicted by WoLF PSORT.


(3-2) Gene page; coexpression part

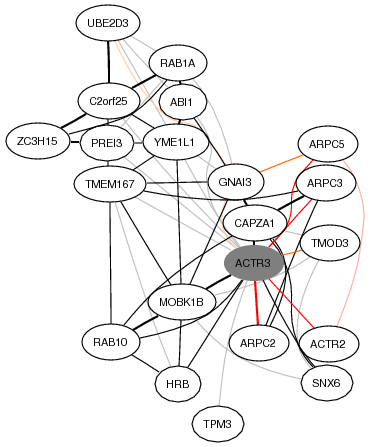
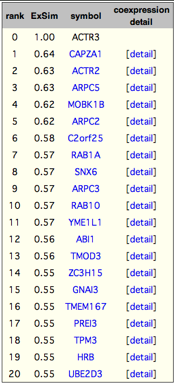
The top 20 highest coexpressed genes are provided in gene page.
  • Each node (circle) represents a coexpressed gene, which works as a link to the corresponding gene page.
    • The shaded node highlights the current gene.
  • Each edge (line) indicates the strength of coexpression by its thickness. [more]
    • The red edges mean existence of reported PPIs (Protein-protein Interactions) annotated by HPRD.
    • The orange edges indicate the existence of conserved coexpression between human and mouse orthologs.

This coexpression network illustrates that ACTR3 expresses with other actin related genes.

  • Arp2/3 complex genes
    • ACTR2
    • APRC2
    • APRC3
    • APRC5
  • Capping proteins of F-actin
    • TMOD3; F-actin capping protein for pointed-end.
    • CAPZA1; F-actin capping protein for barbed-end.
These coexpressed genes strongly supports ACTR3 function as an actin regulator.

The table next to the network is the gene list for the coexpressed gene network above. 'ExSim' indicates expression pattern similarity. Although COXPRESdb mainly used correlation rank rather than correlation value (ExSim here), ExSim are also presented for user convenience. Each symbol is a link to corresponding gene page.

'detail' link shows coexpression detail between the current gene (ACTR3) and each gene. For example, from the 'detail' link for CAPZA1, we can know organs are main samples to judge coexpression between ACTR3 and CAPZA1.


(3-3) Gene page; gene expression part

Gene expression patterns are also provided in this gene page. This gene strongly expresses in immune system organs, vein and oral tissues.


(4) Gene page; gene expression part → Tissue-specific network page

Gene page

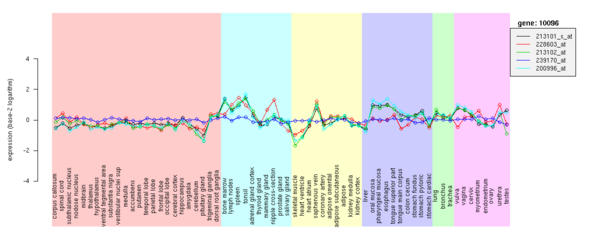
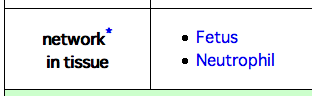
In order to consult the coexpressed gene networks in these expressed tissues, the coexpressed gene networks for tissues are provided (fetus and neutrophil in this example).

Click "Neutrophil" as a representative of immune system organs.


Tissue-specific network page

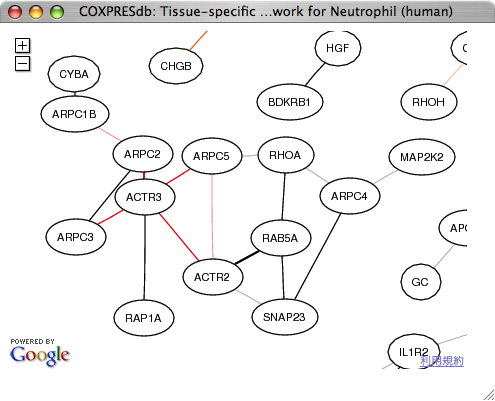
On the tissue-specific network page, ACTR3 is automatically placed at the center of the window. We employed Google Maps API to navigate the huge coexpression network in a tissue.

In the neutrophil, the weak edges on the gene page have disappeared, suggesting that those weakly coexpressed genes are coexpressed in other tissues or samples.

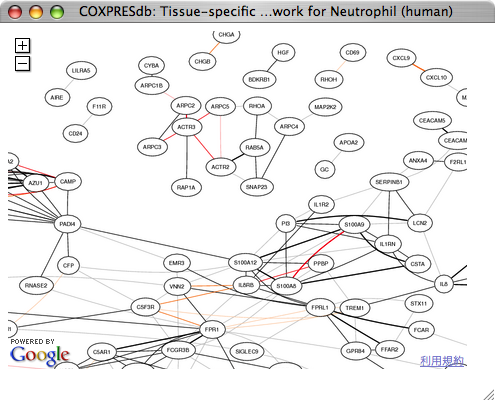
Zoom-out view can be obtained by clicking minus icon at upper-left side.

In the zoom-out view, this coexpression group including ACTR3 composes distinct gene groups for actin regulation, which include all seven subunits of the Arp2/3 complex and other genes for actin regulation.

  • Arp2/3 complex genes
    • ACTR2
    • ACTR3
    • APRC1B
    • APRC2
    • APRC3
    • APRC4
    • APRC5
  • Other genes for actin regulation
    • RHOA
    • MAP2K2
    • RAP1A
Although some of gene pairs such as ARPC1B and ARPC4 are not directly connected, network representation can show the relationships of these genes.


(5) Gene page; functional annotation part → Ortholog page

Gene page

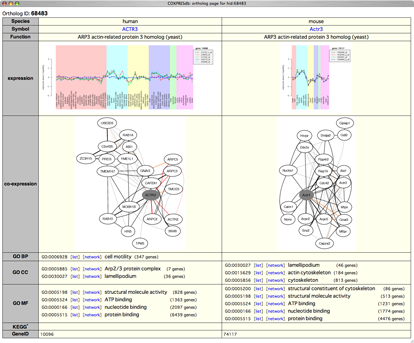
For the comparison of human and mouse orthologs, ortholog pages are provided.

Click 'ortholog page' to move ortholog page for human ACTR3 and mouse Actr3.


Ortholog page

In ortholog page, we can compare tissue-specific gene expression patterns and co-expressed gene networks in parallel views.

In this example, the mouse ortholog, Actr3, has similar tissue-specific expression patterns for immune system organs, and similar co-expressed gene networks.