Some data such as a large series of time-course experiments under a single biological condition are biologically redundant or biased.
Since these biases may mislead to incorrect conclusions, we have corrected these possible redundancies and biases based on Pearson's correlation coefficients (PCCs) between samples.
- First, PCCs between sample S1 and sample S2 were calculated.
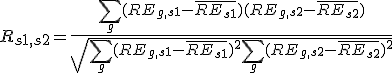
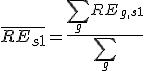
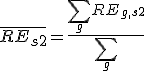
, where REg,s is the relative expression of gene G in sample S,
 is the average relative expression value for all genes in sample S1;
 ,
,
 is the average relative expression value for all genes in sample S2;
 .
.
- For the paiwise sample redundancy (Js1,s2) between sample S1 and sample S2, we introduced the cut-off threshold C to Rs1,s2.
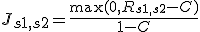 .
.
We used 0.4 for this threshold, which is roughly optimized.
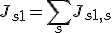
- The sample redundancy Js1 for sample S1 is calculated as the summation of the pairwise sample redundancies between sample S1 and each of all samples including sample S1 itself.
- The weight of sample S1 is the inverse of the square root of the sample redundancy Js1. This procedure is analogous to the calculation of the standard error from the standard deviation. If sample S1 is replicated 4 times with no experimental error, the reliability of the data for sample S1 become double.

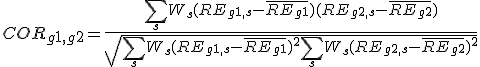
The weighted PCC (
CORg1,g2) was calculated between probe G1 and probe G2.
, where
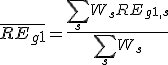
REg,s is relative expression of probe G in sample S,

is the weighted average relative expression value of probe G1;
,

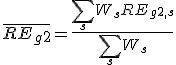
is the weighted average relative expression value of probe G2;
.
Maximum correlation value between all probe combination between two genes was used for correlation between two genes.