last update; Aug. 28. 2018
Although large-scale transcriptome data are available for almost all species, the qualities of the coexpression data constructed from them are quite different.
The quality of the coexpression data mainly depends on the quality, quantity and variety of available gene expression data, as well as on the complexity of the post-transcriptional regulation in the species.
To adequately use coexpression data, an overall quality assessment is necessary.
In addition, the accurate estimation of coexpression data quality provides a basis for the meta-analyses using multiple coexpression data.
Since gene coexpression is used to find gene functional modules, quantification of the degree of coincidence between the coexpression data and the functional annotations is a straightforward approach.
Since we used the Gene Ontology (GO) annotation as the functional annotation of the genes, we call this score the GO score.
Briefly, the all gene pairs in a platform are divided into two categories.
The first category includes gene pairs sharing at least one common functional annotation, and the second category is composed of gene pairs with no common functional annotation.
To measure the difference between the distributions of coexpression strength of the gene pairs in the two categories, AUC
0.01 of a ROC curve is used.
Evaluation of coexpression data by GO score (E-4)
Limitation
One limitation with using GO terms to perform the quality assessments is that this assessment depends on the quality of the GO terms for each species.
Therefore the GO score cannot be applied for inter-species comparison of coexpression quality.
From the results above, the GO scores just suggest the following order of the quality.
- Hsa < Hsa3 < Hsa2
- Mmu2 < Mmu
- Dme2 < Dme
Basic idea
The
supportability is one way to assess given coexpressd gene list, and thus using supportability for the all genes in a platform can be used as a measure of platform quality.
However, supportability only works when high quality platforms are available in the closely-related species.
To use the supportability as a platform quality measure, we should normalize the effect of the quality of the selected reference to calculate supportability.
Here, we apply a naive method to normalize maxCOXSIM by reference quality.

A measure of the adequateness of the reference gene
Since different platforms in the same species are the best reference, the adequateness of the reference guide gene in the same species should be the highest, whereas that of the reference guide gene in the most distant species should be the lowest.
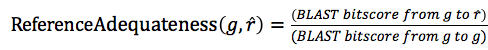
We hypothesized that the conservation of gene modules could be approximated by using the conservation of the guide gene sequences. Based on this idea, we used the conservation ratio of the protein sequences between the target guide gene g and the selected reference guide gene r, to measure the adequateness of the selected guide gene r as reference.
Evaluation of coexpression data by Reproducibility score (E-1)
Weakness of Reproducibility score
Although basic idea that the maxCOXSIM is a function of ReferenceAdequateness could be acceptable, the actual normalization formula is not established. Further investigation is needed.
As another quality measure of gene coexpression, we introduced the Codon score.
Previous reports indicate that codon usage is related to gene function. For example, genes with similar expressions (
Plotkin et al. 2004,
Najafabadi et al. 2009,
Camiolo et al. 2012) or genes that encode interacting proteins (
Najafabadi and Salavati 2008) have similar patterns of codon usage, possibly owing to varying abundance of diverse tRNAs in different tissues.
Given the results of these reports, we constructed a gene similarity matrix based on codon usage. We then measured the degree of coincidence between the coexpression data and the codon usage similarity matrix. To measure similarity between these two gene lists, we used COXSIM.
Median of COXSIM is used as Codon score of the platform.
Evaluation of coexpression data by Codon score (E-2)
The trends of the Reproducibility score and the Codon score are quite similar (correlation=0.86).
Both scores indicate that human, C. elegans and S. cerevisiae are the representative coexpression data sets in COXPRESdb, although the latter two coexpression data sets are not supported enough for individual coexpressed gene list, because of the lack of appropriate reference platforms.